Geocodio serves over 160 million successful API requests every month, totalling over 1.3 billion address and coordinate lookups (many API requests use our batch endpoint).
The API is the backbone of our business, so over the years we have continously worked to improve and ensure consistent performance. We look at many parameters such as uptime and error rates, but one of the key metrics is API response time.
This is how we use this data.
Average response times
For the longest time, we focused on average response times. It is a quick and simple metric that you can quickly break down by API endpoint and time window — What was the average response time the last 5 minutes versus the last 5 hours?
While measuring average response time have their place they can also be deceptive. Take the following sample set of hypothetical response times in milliseconds for 10 tracked requests:
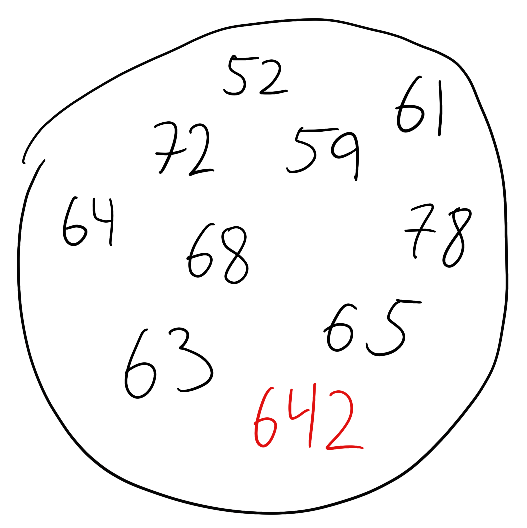
What is the average response time of these 10 requests? The answer is 122.4ms. That doesn’t sound too bad. But it completely hides the fact that one customer got a response in 642ms which is significantly outside the “norm”.
(52 + 61 + 72 + 59 + 64 + 68 + 78 + 63 + 65 + 642) / 10 = 122.4ms
The larger the volume, the more this problem compounds. Luckily there is a solution: Percentiles!
Percentiles
Using percentiles, you will be able to say: “X% of API calls have a response time of Y milliseconds or less.”
To calculate the percentile, you first sort your set of response times:
52, 59, 61, 63, 64, 65, 68, 72, 78, 642
Let’s say we want to calculate the 95th percentile:
totalNumbers = 10
percentile = 95

index = ceil(percentile / 100 * totalNumbers)
index is now 10, which means that “95% of API calls have a response time of 642ms or less.”
You will often want to calculate multiple percentiles:
- The 75th percentile is 72ms
- The 90th percentile is 360ms
- The 99th percentile is 642ms
To get the most out of this type of analysis, you will of course need a much larger set of data.
Real world examples
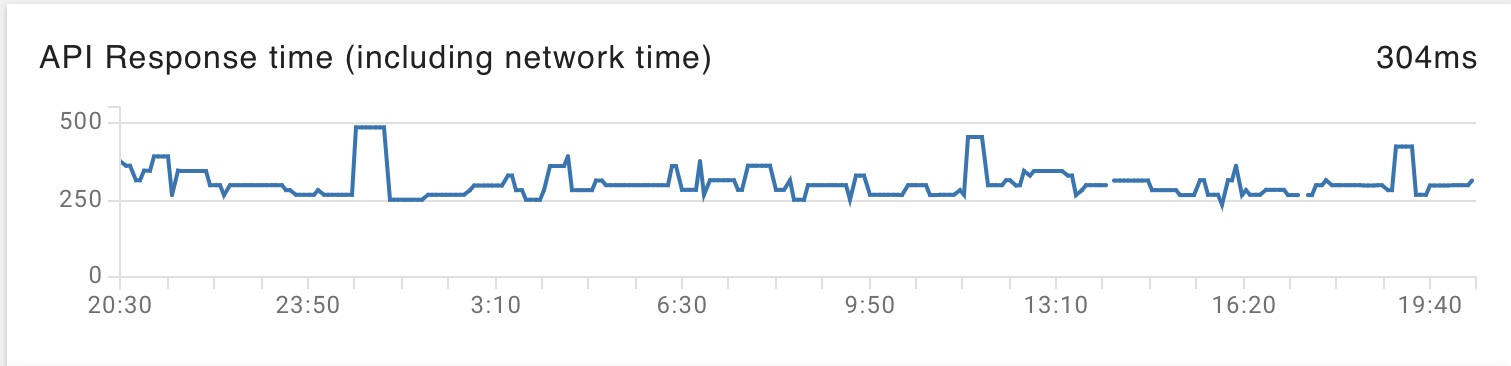
Here are some real examples from the Geocodio API. Each of these reports are based on response times over a 6 hour period.


Looking at the most recent report, we can say that 90% of API requests had a response time of 96ms or less, and that 95% of requests had a response time of 284ms or less.
So how are we using this data in practice? We have had a recent focus on edge case response times. While most API requests process swiftly without issue, a small minority trigger edge cases that cause extraordinarily long response times.
By continously looking at response times broken down by percentiles, we are able to verify that our improvements to these edge cases are having the expected impact in production, and ensure that regressions do not occur.
Bonus: Calculating percentiles in MySQL
Calculating percentiles in a database efficiently can be a bit tricky since a sorted set is needed.
I am using a variation of Roland Bouman’s method that uses GROUP_CONCAT(...) together with SUBSTRING_INDEX(...).
This expects a table named requests with a response_time_ms column.
Note: Depending on the size of your dataset, the standard
group_concat_max_lenMySQL parameter value may be too low. MySQL will not fail if the value overflows, instead you will just receive incorrect results (boo!). Make sure to tweak the parameter, using e.g.SET SESSION group_concat_max_len=18446744073709551615;. You can also test if you are close to the limit, by wrappingGROUP_CONCAT()inLENGTH().
SELECT
SUBSTRING_INDEX(
            SUBSTRING_INDEX(
                GROUP_CONCAT(
                    f.response_time_ms
                    ORDER BY f.response_time_ms
                    SEPARATOR ','
                )
            ,   ','
            ,   75/100 * COUNT(*) + 1
            )
        ,   ','
        ,   -1
) AS `75th Percentile`,
SUBSTRING_INDEX(
            SUBSTRING_INDEX(
                GROUP_CONCAT(
                    f.response_time_ms
                    ORDER BY f.response_time_ms
                    SEPARATOR ','
                )
            ,   ','
            ,   90/100 * COUNT(*) + 1
            )
        ,   ','
        ,   -1
) AS `90th Percentile`,
SUBSTRING_INDEX(
            SUBSTRING_INDEX(
                GROUP_CONCAT(
                    f.response_time_ms
                    ORDER BY f.response_time_ms
                    SEPARATOR ','
                )
            ,   ','
            ,   95/100 * COUNT(*) + 1
            )
        ,   ','
        ,   -1
) AS `95th Percentile`,
SUBSTRING_INDEX(
            SUBSTRING_INDEX(
                GROUP_CONCAT(
                    f.response_time_ms
                    ORDER BY f.response_time_ms
                    SEPARATOR ','
                )
            ,   ','
            ,   99/100 * COUNT(*) + 1
            )
        ,   ','
        ,   -1
) AS `99th Percentile`
FROM requests AS f;