At Geocodio, we’re now actively running close to 100 servers and the number keeps growing.
Because of that, we decided to sit down and design a more robust system for collecting realtime metrics for each server, allowing us to monitor much more than just uptime.
We wanted to collect at least CPU/memory/disk usage, but also add additional metrics on top of that when necessary.
This is what we came up with.
Goals
- Simple: Easy to maintain and reason with
- Flexible: Ability to track custom metrics and track different metrics based on the server role
- Scalable: Should be able to serve us now as well as within the foreseeable future
Overview
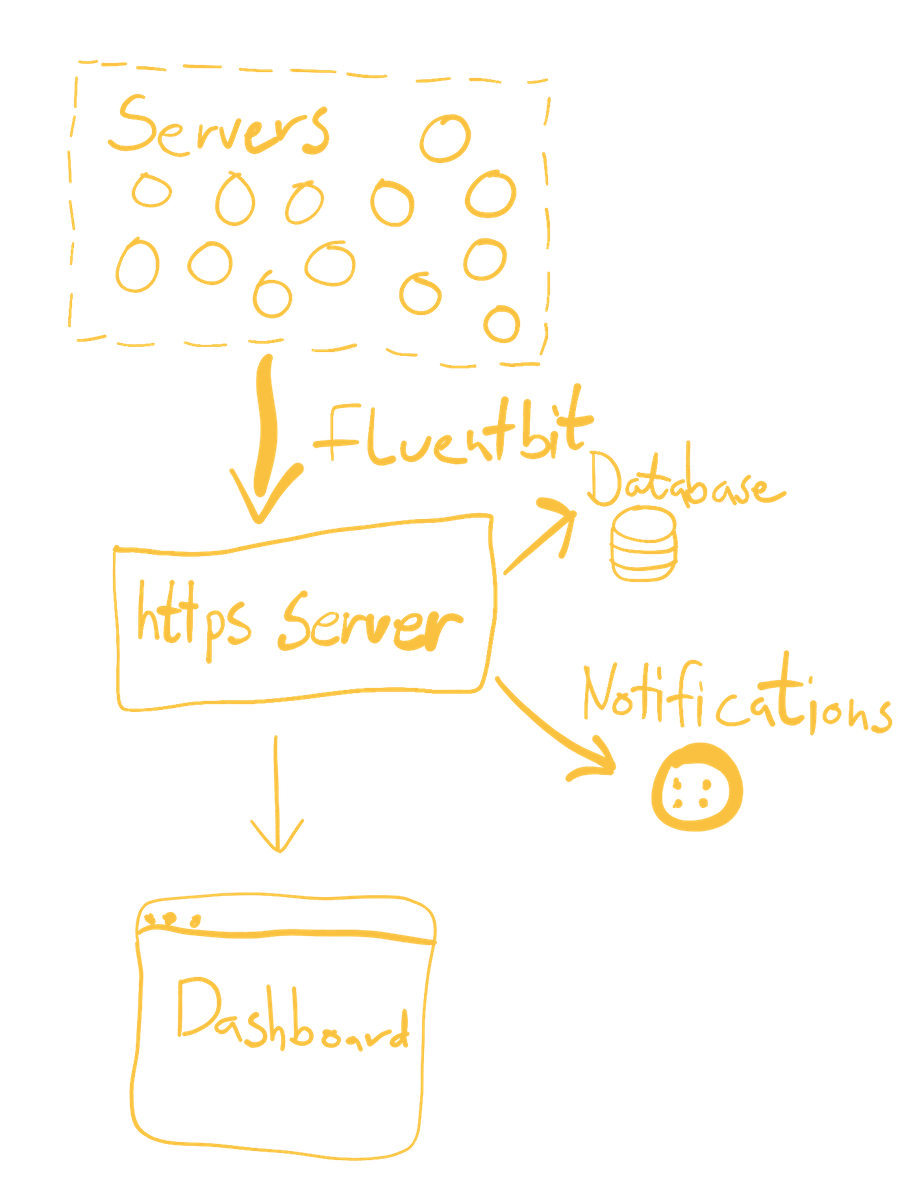
We’re using Fluentbit which is an excellent open-source log forwarder. The Fluentbit daemon runs on each individual server. It comes with a minimal CPU and memory footprint, and allows for buffering of the collected data.
The data is recorded, tagged and then passed on to a simple web server. This server is responsible for storing the events in a database (for historic logging) and for sending notifications via Twilio when necessary, based on some simple rules.
Let’s take a more detailed look into each component.
Fluenbit
We run Fluentbit as a docker container on each server. We ended up making a small fork of the official Fluentbit docker image which includes a Docker client. This allows us to run docker commands from within the Fluentbit container, making it possible to collect Docker metrics through docker inspect or docker stats
A typical config file looks like this:
[INPUT]
    Name          tcp
    Port          5170
    Chunk_Size    32
    Buffer_Size   64
    Tag           custom

[INPUT]
    Name          cpu
    Tag           cpu_usage
    Interval_Sec  60
    Interval_NSec 0

[INPUT]
    Name          mem
    Tag           memory_usage
    Interval_Sec  60
    Interval_NSec 0

[INPUT]
    Name          exec
    Tag           disk_space
    Command       df --output=pcent --type=ext4
    Interval_Sec  60
    Interval_NSec 0

[INPUT]
    Name          exec
    Tag           app_tag
    Command       docker inspect --format '{{json .Config.Labels}}' app
    Interval_Sec  300
    Interval_NSec 0

[INPUT]
    Name          health
    Host          127.0.0.1
    Port          80
    Interval_Sec  5
    Interval_NSec 0
    Tag           web_health

[FILTER]
    Name          record_modifier
    Match         *
    Record hostname ${PARENT_HOSTNAME}

[FILTER]
    Name          lua
    Match         *
    script        /etc/fluent-bit/scripts/append_tag.lua
    call          append_tag

[OUTPUT]
    Name          http
    Match         *
    Host          your-tracking-endpoint-goes-here.com
    Port          443
    Format        json
    URI           /track
    tls           On
A quick explanation:
Inputs
tcp: Runs a local TCP server that allows us to track custom events.cpu,mem,exec: These track CPU, Memory and Disk Usage every 60 seconds. We are usingexecfor disk usage because the built-in fluentbit input method tracks disk activity rather than available diskspace.exec: The lastexecinput is used to fetch the labels of one of the running docker containers. We’re using this to monitor what version of the server that we are running.health: Is a simple health check that checks that port 80 is responding.
Filters
We have two filters in-place which modifies the tracked events.
The first filter ensures that the hostname of the server is attached to the event, so we can track where it’s coming from.
The second filter is a tiny lua script that ensures that the tag name is kept for the event when it is transmitted. This makes it much easier to organize the events later on.
Output
This points to our internal webserver that accepts the collected event(s) as a JSON blob.
Fluentbit custom events
Being able to track custom events is extremely powerful. For our app server we use this feature to keep track of incoming API calls in realtime.
A simple netcat command is all it takes to send an event.
For database servers, we use this to track MySQL replication status in realtime: https://github.com/Geocodio/docker-mysql-replication-monitor-fluentbit.
Webserver
The webserver is a simple Node.js app. Its job is to receive events, store them in the database and send notifications if necessary. It is also configured to stream server-sent events which allows us to publish data on a dashboard in realtime.
Our production app is approximately 200 lines of code. Here’s a slightly simplified version (please add your own authentication scheme):
server.js
'use strict';

const http = require('http');
const express = require('express');
const mysql = require('mysql');
const SSE = require('express-sse');
const sse = new SSE();
const constants = require('./constants');
const notifyEvent = require('./notifyEvent');

function start(allowedIpAddresses) {
	const connection = mysql.createConnection(constants.mysql);

	try {
		connection.connect();
	} catch (error) {
		console.log('MySQL Connection Eror: ', error.message || error);
	}

	const app = express();
	app.use(express.json({
		limit: '1024kb'
	}));

	/**
	 * POST /track
	 * Write-only route that receives fluentbit data from servers
	 */
	app.post('/track', (req, res) => {
		req.body.forEach(event => {
			const isDiskSpaceEventWithIrrelevantData = event.tag === 'disk_space' && !event.exec;

			if (!isDiskSpaceEventWithIrrelevantData) {
				if (event.tag === 'disk_space' && typeof event.exec !== 'undefined') {
					event.exec = parseInt(event.exec);
				}

				sse.send(event, 'result');
				notifyEvent(event);

				const parameters = {
					created_at: { toSqlString: () => 'FROM_UNIXTIME(' + parseFloat(event.date) + ')' },
					tag: event.tag,
					hostname: event.hostname,
					data: JSON.stringify(event)
				};

				connection.query('INSERT INTO events SET ?', parameters, (error, results, fields) => {
					if (error) {
						console.log('Insert error: ', error.message || error)
					}
				});
			}
		});

		res.send("OK\n");
	});

	/**
	 * GET /stream
	 * Read-only route that streams fluentbit data that were received from servers via the /track route
	 */
	app.options('/stream', middlewares);
	app.get('/stream', middlewares, sse.init);

	http.createServer(app).listen(constants.server.port, constants.server.host);

	console.log(`Running on https://${constants.server.host}:${constants.server.port}`);
}
notifyEvent.js
'use strict';

const constants = require('./constants');
const Twilio = require('twilio');

const client = new Twilio(constants.twilio.accountSid, constants.twilio.authToken);

let notifications = {};

const renotifyThresholdMS = 1000 * 60 * 60 * 12; // 12 hours

function notifyEvent(event) {
	purgeNotifications();

	if (event.tag === 'disk_space' && typeof event.exec !== 'undefined') {
		if (event.exec > 95) {
			report(event, 'ERROR', `Disk space is ${event.exec}%`);
		} else if (event.exec > 90) {
			report(event, 'WARNING', `Disk space is ${event.exec}%`);
		}
	}

	// TODO: Add more rules here
}

function purgeNotifications() {
	const cutOffTimestamp = Date.now() - renotifyThresholdMS;

	for (var key in notifications) {
		if (notifications[key] < cutOffTimestamp) {
			delete notifications[key];
			console.log('Deleted key');
		}
	}
}

function report(event, severity, message) {
	const key = event.hostname + severity + message;

	if (!(key in notifications)) {
		notifications[key] = Date.now();

		const body = `${severity}: ${message} on ${event.hostname}`;
		console.log(`Sending "${body}"`)

		client.messages.create({
			body,
			from: constants.twilio.fromPhoneNumber,
			to: constants.twilio.toPhoneNumber,
		});
	}
}

module.exports = notifyEvent;
Database
We’re using a simple MariaDB database for historic data. One row per event, with most of the event data stored as a JSON blob.
CREATE TABLE `events` (
  `id` int(11) unsigned NOT NULL AUTO_INCREMENT,
  `created_at` datetime DEFAULT NULL,
  `tag` varchar(255) DEFAULT NULL,
  `hostname` varchar(255) DEFAULT NULL,
  `data` longtext CHARACTER SET utf8mb4 COLLATE utf8mb4_bin DEFAULT NULL,
  PRIMARY KEY (`id`),
  KEY `created_at` (`created_at`),
  KEY `hostname` (`hostname`,`tag`,`created_at`)
) ENGINE=InnoDB DEFAULT CHARSET=utf8mb4
Dashboard
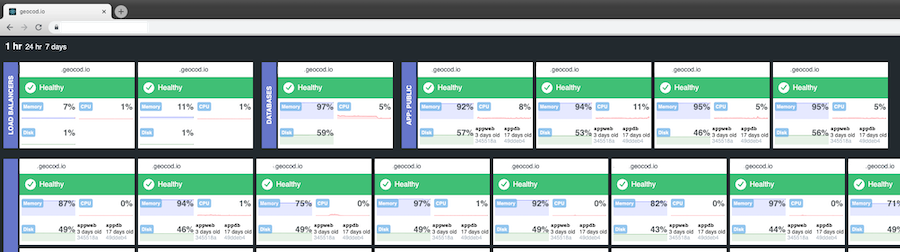
We built a custom dashboard for visualizing all of this neat data. There are of course dozens (if not hundreds) of open source options for creating web-based metric dashboards. But hey - this is the fun part.
The dashboard consumes realtime and stored data from the webserver, and visualizes it using Tailwind CSS and react-sparklines.
Conclusion
With Fluentbit and a simple Node.js server, we’re able to securely collect high volumes of events with minimal overhead and spending less than $60/month to keep the entire thing running.